Organization widget
Use the Organization widget Visual building block in an application that is interchangeable, depending on system or user configurations. on the Explore Performance page to view performance information on a selected organization. The widget only appears if a single organization is selected. The organization picture (if available), name, and total performance score display based on the time period selected. When the Drill to Employees in Organization or Drill to Sub-organizations icons display, you can drill down to view additional information.

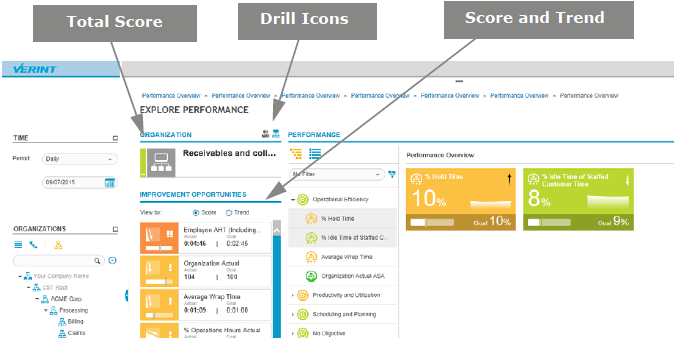
Total Score is the average of the Objective Score if there are objectives, or KPI Score if there are no objectives. Total Score is calculated based on the KPIs that are displayed. If Scorecard filters are applied to the Explore Performance page, the Total Score can change.
When you point to the Total Score icon, the score tooltip displays.
|
Element |
Description |
|---|---|
|
Gray
|
No score or user does not have privilege Permissions associated with each role that define the features of the application a user is able to view and the functionality in the application the user can access. to view score |
|
Dark Green
|
Excellent: Score exceeded the goal by the variance level or more. |
|
Light Green
|
Good: Score met the goal at the planned goal or within the variance level toward the direction of the variance. |
|
Light Orange
|
Average: Score is within the variance level, but away from the direction of the variance. |
|
Dark Orange
|
Poor: Score missed the goal by more than the allowed variance level. |
|
Red
|
Out of Range: Score is outside the value range. |
